This blog post is about the production issue which we had last week and it started with the following Alerts.
- We use tail_n_mail to monitor all our PostgreSQL server log files and on that particular day tail_n_mail alerted with the following content. "FATAL: too many connections for role "produser"
- We also use Nagios based alerting/graphing both for system(cpu,disk etc) and database(Check_Postgres). On that particular day we also received an email from nagios indicating that the cpu usage have been hovering around 80%
Based on the above alerts we thought that the database had more hits compared to average hits. On logging into database we found more number of queries running for long which seemed unusual because all queries on our production finishes within milliseconds. On running EXPLAIN plan on the query we found the real issue which was a missing index for a new application feature which was just enabled for all customers. So the reasoning of how a missing index triggered the alerts is below.
- The number of hits to the database was indeed normal however the queries were taking too long to execute due to missing index
- Since the index was missing, the application queries were executing with a Sequential Scan which caused the spike in CPU usage.
- On the other hand since queries were taking longer, new requests from application requested the database to allocate more number of connections which eventually led to running out of connection allowed for that particular produser.
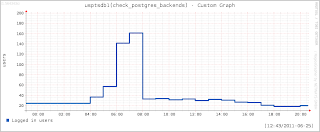
Based on the above reasoning we immediately created a new index on that particular table which caused the alerts to go away and this is clearly visible from the below graphs.
The graphs shows that once the index creation was done the cpu usage reduced to less than 5% and also the number of connections reduced to the older levels of around 20.
From the above incident we got the below priority items to be fixed:
- Use connection pooler so that in future requests will be queued at the pooler rather than being denied for connection.
- Enable Nagios alerting for queries running above certain threshold using check_postgres.pl
- Evaluate all application queries before pushing it to production.
In short be aware of the fundamentals for database performance like missing indexes else it could create a havoc for database performance.


How might troubleshoot High CPU Usage in Postgres? Contact to Postgres SQL Support for Windows
ReplyDeleteIn any of the conditions on the off chance that you found that high CPU use issue in Postgres or if Postgres server neglects to begin then without a lot of stretch straightforwardly contact to Postgres SQL for Linux or PostgreSQL Remote Database Service.
The Cognegic offers PostgreSQL Relational Database Service for their clients who standing up to numerous specialized hiccups likes: establishment issue, setup issue, not ready to begin, login issue, recuperation issue and reinforcement issue. Connect with our high qualified and affirmed proficient specialists to bring the correct arrangement in regards to Postgres database.
For More Info: https://cognegicsystems.com/
Contact Number: 1-800-450-8670
Email Address- info@cognegicsystems.com
Company’s Address- 507 Copper Square Drive Bethel Connecticut (USA) 06801